Loading the guide…
Track email performance
Learn where to find delivery and engagement metrics, what each one means, and how to read them across your space.
On this page
After you send email, maxclicks tracks what happened to it: what was delivered, opened, clicked, bounced, and reported as spam. These metrics live in several places, all showing real data aggregated live from actual email events. This article explains the metrics, where to find them, and how to read them. Any member of the space can open a broadcast's or a template's metrics tab. The space-level Metrics dashboard needs Write permission.
The metrics you get
Every email you send moves through a lifecycle, and maxclicks records the provider's events as they arrive. The counts you see are built from those real events, not estimates.
| Metric | What it means |
|---|---|
| Delivered | The receiving mail server accepted the message |
| Opened | The recipient opened the email |
| Clicked | The recipient clicked a link in the email |
| Bounced | Delivery failed, permanently (hard) or temporarily (soft) |
| Complained | The recipient marked the email as spam |
A few of these have consequences beyond the number. A hard bounce and a spam complaint each automatically add a suppression on that address and revoke its email subscriptions, so maxclicks stops sending to an address that bounced or complained. That is how the platform protects your sending reputation without you intervening. Read manage suppressions for how suppressions work and how to review them.
Open and click tracking depend on the recipient's mail client, so treat opens and clicks as strong signals rather than exact truth: some clients suppress the open pixel, and some prefetch links. Delivered, bounced, and complained are firmer, because they come from the receiving server or the recipient's own action.
The space-level dashboard
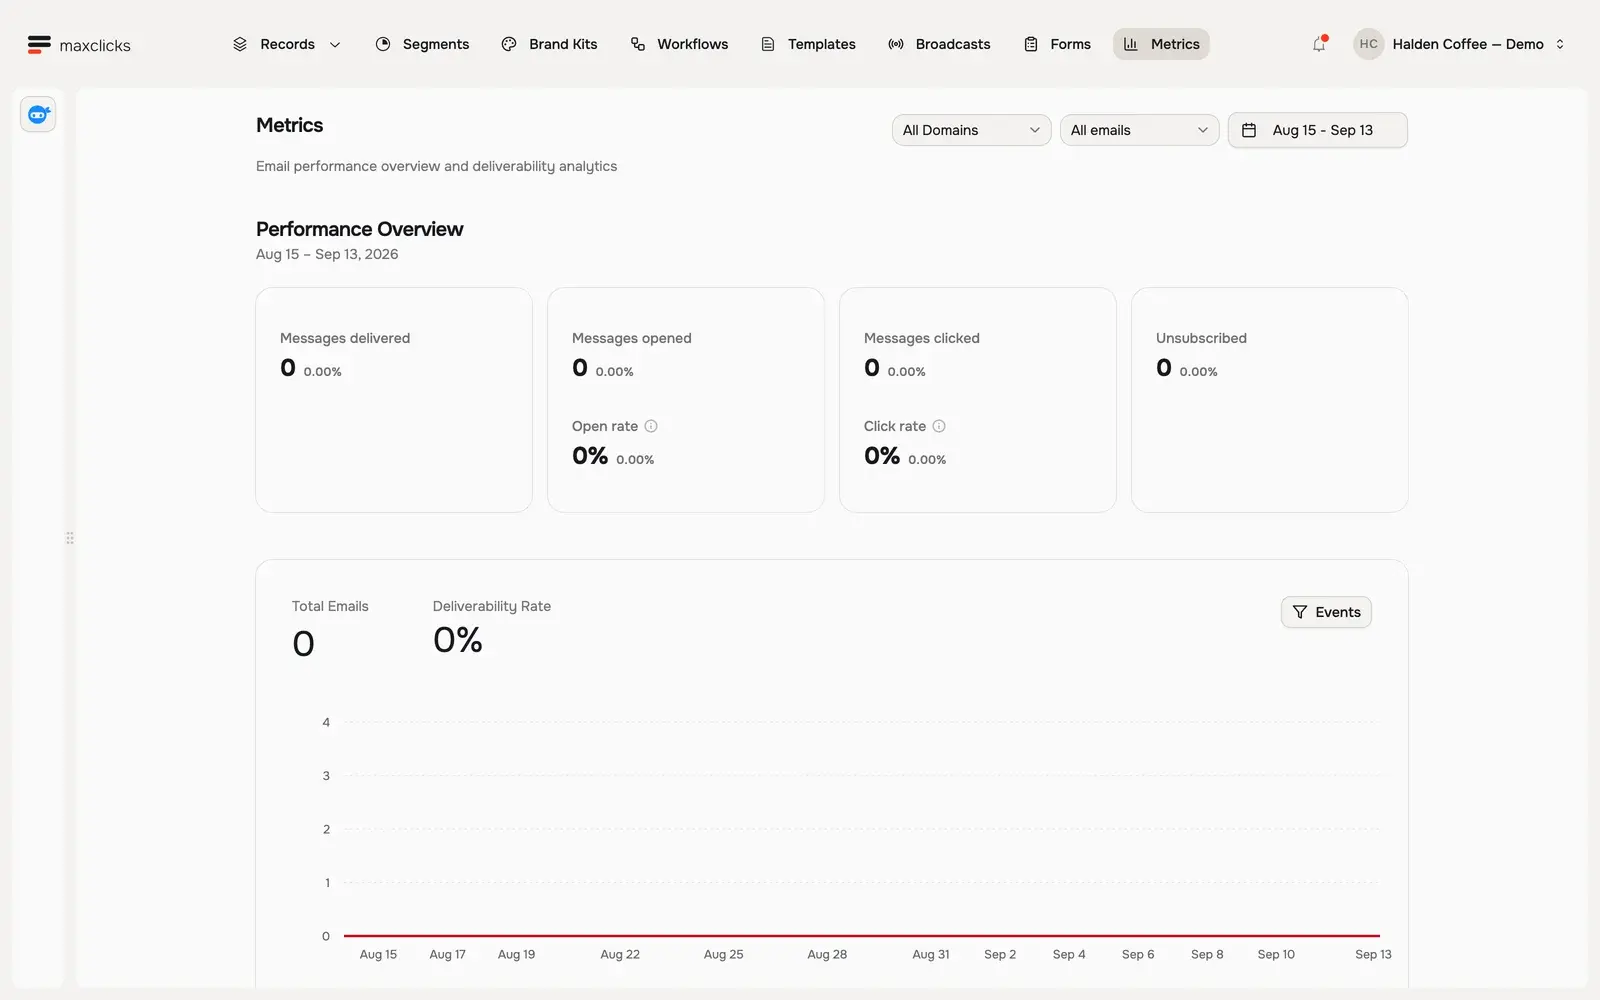
The Metrics page in the top navigation is your space-wide email performance dashboard. It aggregates the metrics above across all the email your space has sent, so it answers the broad question of how your email is doing overall rather than how one send performed. The data is real, aggregated live from actual email events.
This page needs Write permission. The item appears in the navigation for everyone, but opening it without Write returns a permission error, and Admin permission on its own does not stand in for Write. Per-send metrics tabs have no such gate.
Use the space-level dashboard for the trend: whether delivery is healthy, whether opens and clicks are holding up, whether bounces or complaints are creeping into a range that threatens deliverability. When a single send looks off, drop down to that send's own metrics to see the detail.
Broadcast metrics
Each broadcast has its own metrics tab that shows how that one send landed: delivered, opened, clicked, bounced, and complained counts for that broadcast alone. Because a broadcast fans out into a per-contact run for every recipient, the metrics tab is where those individual outcomes roll up into totals you can read at a glance.
This is the tab to watch after a send. A healthy broadcast shows most of the audience delivered and a reasonable share opened. A spike in bounces points at list quality, and any complaints are worth investigating before your next send. The numbers are real and update live as events arrive, so open the tab shortly after sending and check back as engagement accumulates.
- Open the broadcast
Open Broadcasts from the top navigation and select the broadcast you sent.
- Open its metrics tab
Switch to the broadcast's metrics tab. It shows the delivery and engagement counts for that broadcast, aggregated from real email events.
- Cross-check the per-email list
For a single recipient's outcome, use the broadcast's per-email list alongside the metrics tab. The list shows individual sends; the tab shows the totals.
Template metrics
A stored template, the kind sent per recipient through the API, also has a metrics tab. Because a template is sent one recipient at a time over its lifetime rather than in a single burst, its metrics tab aggregates every send of that template into running totals: how many were delivered, opened, clicked, bounced, and complained across all of the template's sends. This is how you judge the health of a transactional or recurring template that fires continuously in the background. Any member can open it, the same as a broadcast's tab.
One email's own history
Totals answer how a send performed in aggregate. Sometimes you need one message's story: did this recipient's email deliver, open, or bounce. A broadcast's per-email list holds each individual send, and every email records its own lifecycle as events arrive: sent, delivered, opened, clicked, bounced, complained, and platform events like sending failed. Use the list to trace one recipient, and the metrics tab for the shape of the whole send.
Per-workflow metrics
Each published workflow has a metrics tab, with a Versions picker so you read one version at a time. It shows that version's total, completed, and failed run counts, the average time a run spends in each step, how many runs took each branch, and, for every send-email step, that step's own delivery and engagement funnel. The numbers come from real email events and real run history, the same sources as broadcast and space-level metrics.
Pair the tab with the workflow's run history, which records every run step by step, with timestamps, the path each run took, and the reason for any failure, and updates in real time. The tab tells you where runs slow down and how each email performed, and the run history tells you what happened to one run. Understand workflow runs and fix failures covers reading it. The email a workflow sends also flows into the space-level dashboard, so it counts toward your overall picture too.
Act on what the metrics tell you
Metrics are only useful if they change what you do next. A few patterns point at clear actions.
- Bounces rising. A climbing bounce count usually means stale or invalid addresses in your list. Hard bounces already suppress themselves, so the platform stops sending to them, but a high rate is a signal to clean the source your contacts come from. Review your suppressions in manage suppressions.
- Complaints appearing. Any spam complaint is worth taking seriously: it suppresses the address and revokes its subscriptions automatically, and a pattern of complaints hurts your reputation. It often means the mail was unexpected or off-target. Revisit who you sent to and whether the content matched what they consented to, covered in understand transactional vs marketing.
- Low opens. The subject line and the preview text are the levers on opens. If a send under-performs, those are the first things to change on the next one.
- Good opens but low clicks. People are reading but not acting. That points at the body and the call to action rather than the subject.
Read the space-level dashboard for the trend and a single send's tab for the specifics, then adjust the next send accordingly.
What the numbers are built from
Every metric in maxclicks is aggregated live from actual email lifecycle events reported by the sending provider: sent, delivered, opened, clicked, bounced, complained, and more. As those events arrive, the counts update. This is why a send's metrics grow for a while after it goes out: opens and clicks trickle in over hours and days, not all at once.
Each contact also carries its own rollup. A contact record tracks how many emails it was sent, and how many were delivered, bounced, complained about, opened, and clicked, recomputed from that contact's real events every time one lands. It shows in the contacts table and on the contact page. Use it to answer questions about one person, and the Metrics dashboard or a broadcast's or template's metrics tab for the shape of a whole send.
Tag marketing links
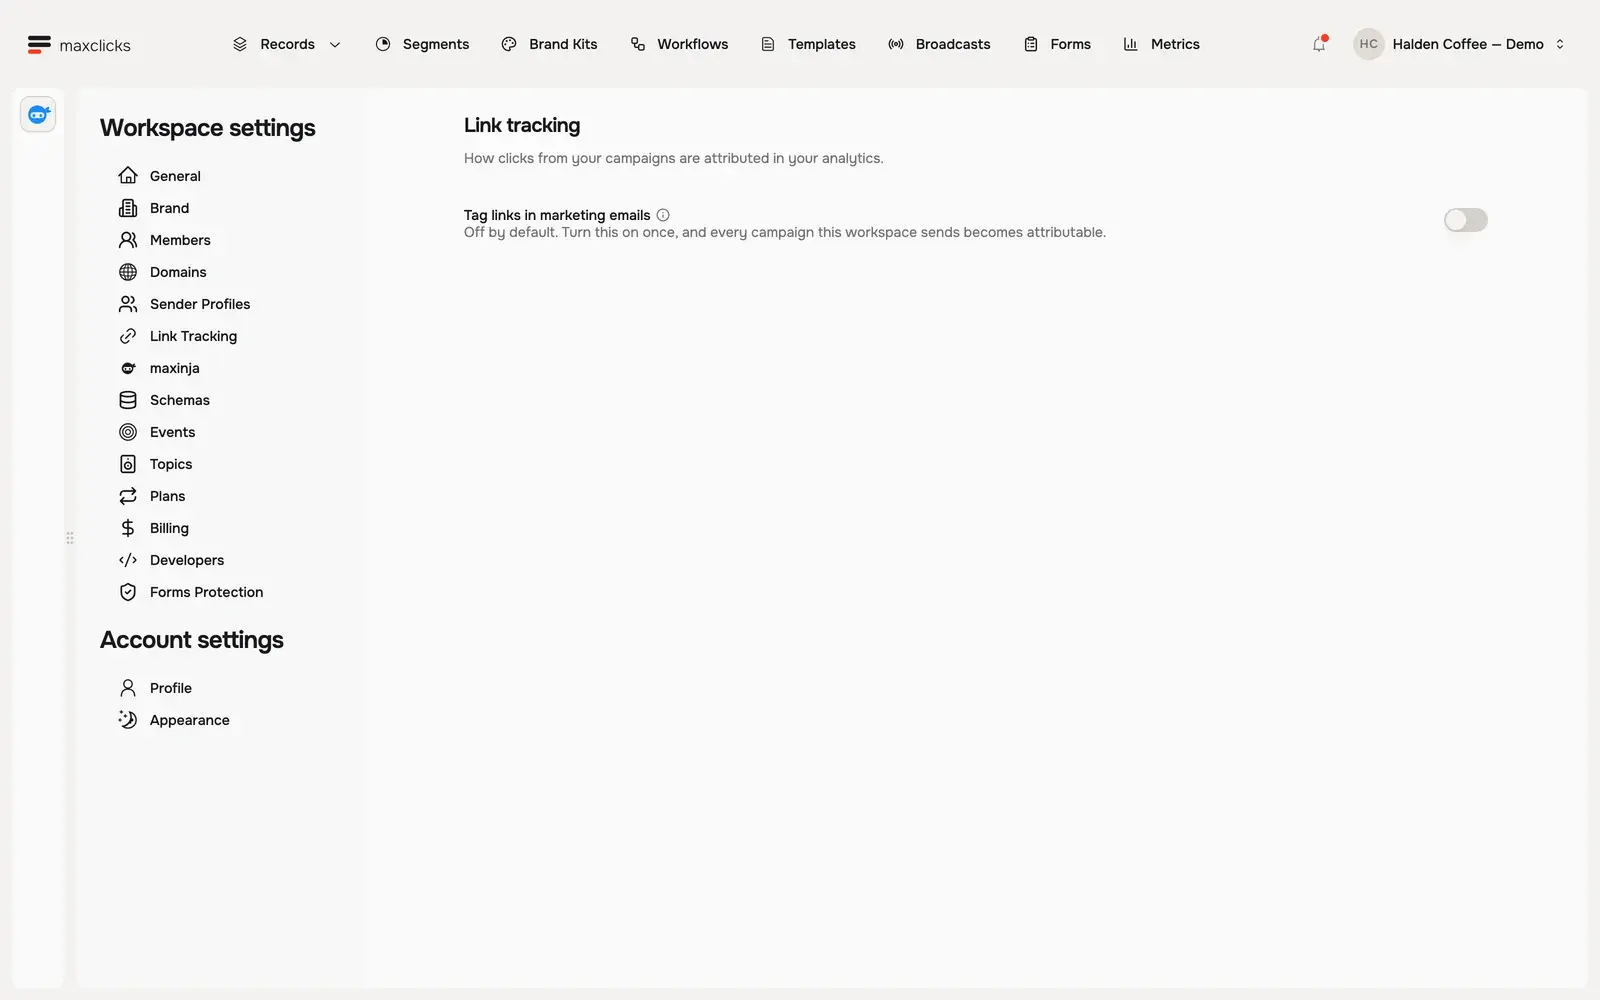
Under Settings → Link Tracking, choose whether maxclicks adds campaign attribution tags to marketing links. This setting is separate from the delivery and engagement counts above.
Frequently asked questions
Do I need Write permission to view metrics?
Not for a single send. Any member can open a broadcast's or a template's metrics tab. The space-level Metrics dashboard is the exception: it needs Write permission, so an admin without Write cannot open it.
Are the metrics real or estimated?
Real. Broadcast, template, workflow, and space-level metrics are all aggregated live from actual email events reported by the provider. Delivered, bounced, and complained come from the receiving server or the recipient. Opens and clicks depend on the recipient's mail client, so read them as strong signals rather than exact counts.
Why do a broadcast's numbers keep changing after it sends?
Engagement events arrive over time. Opens and clicks accumulate for hours or days after a send, so the metrics grow as those events come in. Check back rather than judging a send in the first few minutes.
Can I see how an individual workflow's email is performing?
Yes. Open the workflow, switch to its metrics tab, and pick the version you want. Each send-email step shows its own delivered, opened, clicked, bounced, and complained counts. The same email also counts toward the space-level Metrics dashboard.
Where do I see one contact's email performance?
Open the contact. Its email statistics are recalculated from that contact's own delivery and engagement events, so they stay current. A contact that has not been emailed yet shows nothing.
Did this article answer your question?